Learn how you can Unlock Limitless Customer Lifetime Value with CleverTap’s All-in-One Customer Engagement Platform.

In the previous article, we discussed some techniques to deal with missing data. We will now look at an example where we shall test all the techniques discussed earlier to infer or deal with such missing observations.
With the information on Visits,Transactions, Operating System, and Gender, we need to build a model to predict Revenue. The summary of the information is given below: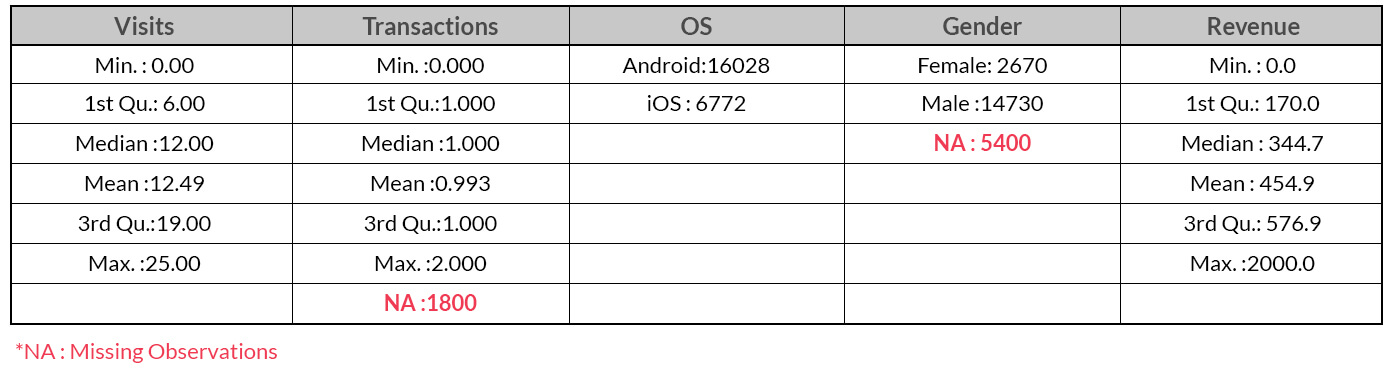 We have a total of 7200 missing data points (Transactions: 1800, Gender: 5400) out of 22,800 observations. Almost 8% and 24% data points are missing for ‘Transactions’ and ‘Gender’ respectively.
We will be using a linear regression model to predict ‘Revenue’.
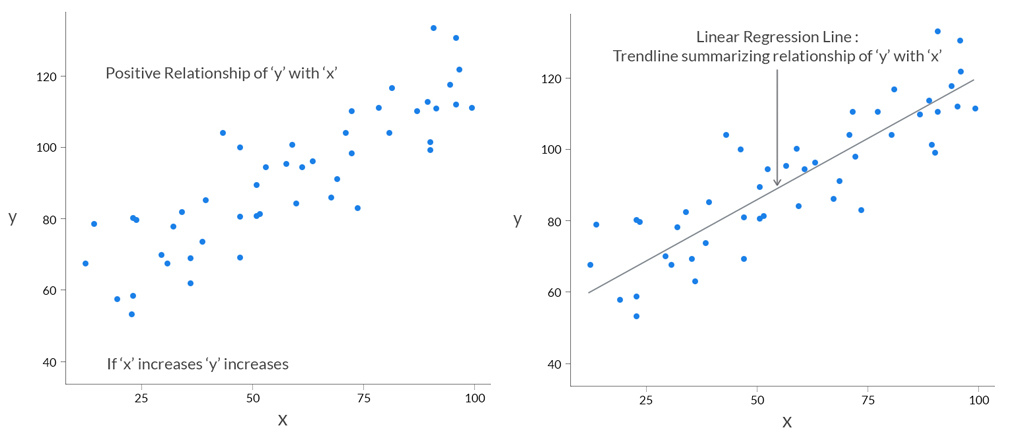
A quick intuitive recap of Linear Regression
Assume ‘y’ depends on ‘x’. We can explore their relationship graphically as below:
 Missing Value Treatment
Let’s now deal with the missing data using techniques mentioned below and then predict ‘Revenue’.
A. Deletion
Steps Involved:
i) Delete
Delete or ignore the observations that are missing and build the predictive model on the remaining data. In the above example, we shall ignore the missing observations totalling 7200 data points for the 2 variables i.e. ‘Transactions’ and ‘Gender’.
ii) Impute ‘Revenue’ by Linear Regression
Build a Linear model to predict ‘Revenue’ with 15,600 observations.
B. Impute by Average
Steps Involved:
i) Impute ‘Transactions’ by Mean
We shall impute the missing data points for ‘Transactions’ variable by looking at the group means of ‘Transactions’ by ‘OS’.
Mean of Transactions for Users on Android: 0.74
Mean of Transactions for Users on iOS: 1.54
All the missing observations for ‘Transactions’ will get 0.74 and 1.54 as its value for Users on Android and iOS respectively.
ii) Impute ‘Gender’ by Mode
Since ‘Gender’ is a categorical variable, we shall use Mode to impute the missing variables. In the given dataset, the Mode for the variable ‘Gender’ is ‘Male’ since it’s frequency is the highest. All the missing data points for ‘Gender’ will be labeled as ‘Male’.
iii) Impute ‘Revenue’ by Linear Regression
Build a Linear model to predict ‘Revenue’ with the entire dataset totalling 22,800 observations.
C. Impute by Predictive Model
Steps Involved:
i) Impute ‘Gender’ by Decision Tree
There are several predictive techniques; statistical and machine learning to impute missing values. We will be using Decision Trees to impute the missing values of ‘Gender’. The variables used to impute it are ‘Visits’, ‘OS’ and ‘Transactions’.
ii) Impute ‘Transactions’ by Linear Regression
Using a simple linear regression, we will impute ‘Transactions’ by including the imputed missing values for ‘Gender’ (imputed from Decision Tree). The variables used to impute it are ‘Visits’, ‘OS’ and ‘Gender’.
iii) Impute ‘Revenue’ by Linear Regression
Build a Linear model to predict ‘Revenue’ with the entire dataset totalling 22,800 observations.
A common and quick way to evaluate how well a linear regression model fits the data is the coefficient of determination or R2.
^{2}}{\mathrm{(y_{i} - \bar{y})^{2}}}")
where = predicted response; = observed response; = mean response
R2 will remain constant or keep on increasing as long as you add more independent variables to your model. This might result in overfitting.
Adjusted R2 overcomes this shortcoming of R2 to a great extent. Adjusted R2 is a modified version of R2 that has been adjusted for the number of predictors in the model.
where = R-squared; = Number of Observations; = Number of predictors or independent variables
Let’s compare the linear regression output after imputing missing values from the methods discussed above: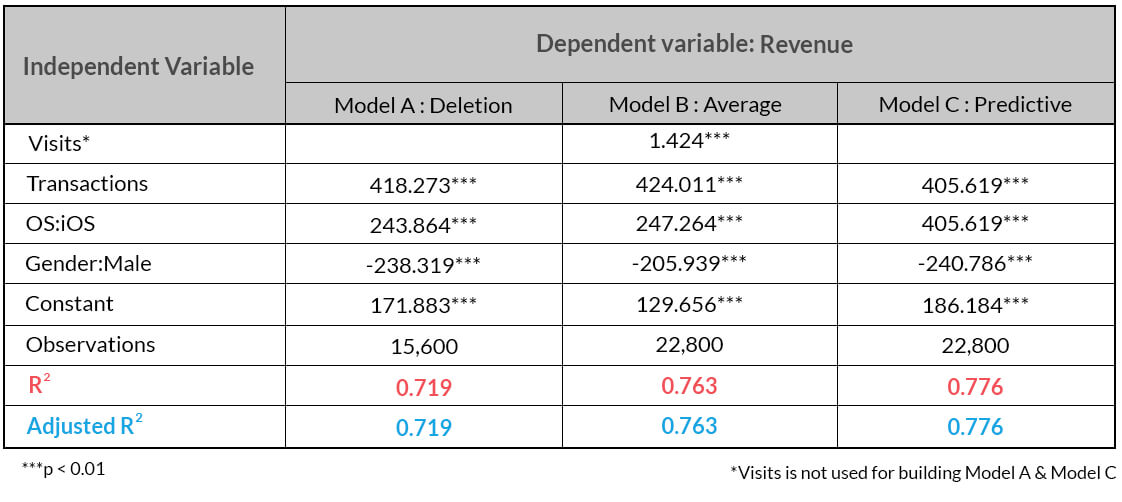 In the above table, the Adjusted R2 is same as R2 since the variables that do not contribute to the fit of the model haven’t been taken into consideration to build the final model.
Inference:
Imputation of missing values is a tricky subject and unless the missing data is not observed completely at random, imputing such missing values by a Predictive Model is highly desirable since it can lead to better insights and overall increase in performance of your predictive models.
Source Code and Dataset to reproduce the above article available here