Learn how you can Unlock Limitless Customer Lifetime Value with CleverTap’s All-in-One Customer Engagement Platform.

When building an app, long-term success does not mean only getting someone to download your app. It means also getting them to make repeat visits. How do you measure that accurately? Using vanity metrics like download counts, daily active users (DAU), or monthly active users (MAU) only measures growth and retention superficially. To dig deeper into how users spend time in your app, you should use Cohort Analysis.
Cohort analysis is a subset of behavioral analytics that takes the data from a given eCommerce platform, web application, or online game and rather than looking at all users as one unit, it breaks them into related groups for analysis. These related groups, or cohorts, usually share common characteristics or experiences within a defined time-span.
Cohort analysis is a tool to measure user engagement over time. It helps to know whether user engagement is actually getting better over time or is only appearing to improve because of growth.
Cohort analysis proves to be valuable because it helps to separate growth metrics from engagement metrics as growth can easily mask engagement problems. In reality, the lack of activity of the old users is being hidden by the impressive growth numbers of new users, which results in concealing the lack of engagement from a small number of people.
Let’s understand using cohort analysis with an example – daily cohort of users who have launched an app first time and revisited the app in the next 10 days.
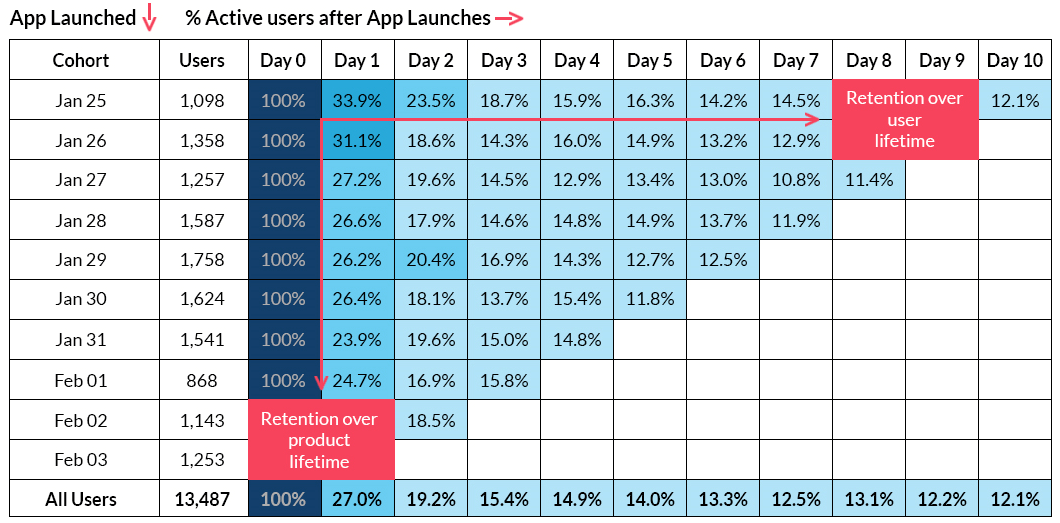
From the above retention table – Triangular chart, we can infer the following
Furthermore, there are two main benefits of reading the above cohort table:
Whatever the evaluation key metrics you define for the business, cohort analysis lets you view how the metrics develop over the customer lifetime as well as over the product lifetime.
Cohort analysis involves looking at the groups of people, over time, and observing how their behavior changes. For instance, if we send out an email notification to 100 people, some may buy the product on day 1, less on day 2, even fewer on day 3, and so on. But, if we send another email to 100 people, after few weeks, they’ll be buying the product on their “day 0”while the first sent email might show its prevalent lag effect on the buying decision.
In order to track how users behave over time or how the same behavior differs for different cohorts, cohort analysis helps to compare these people by the way / time they were acquired or by the retention of those users over time.
But, how to break the group of users into cohorts for cohort analysis – can be done in two ways:
Unlock long-lasting growth with CleverTap now!
Let’s see how you can use both acquisition and behavioral cohorts to determine exactly what your users are doing and when they’re doing it.
Revisiting the above daily cohort – which is an acquisition cohort.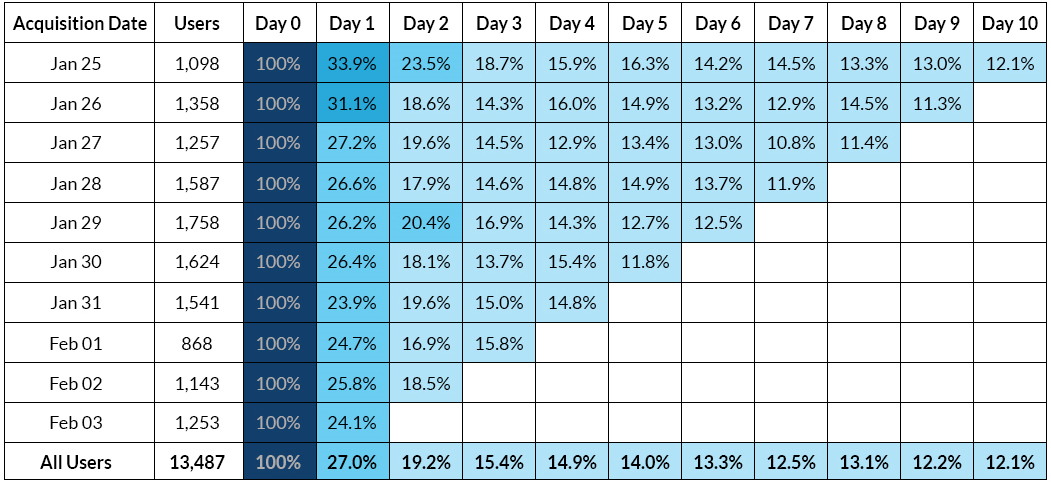
One way to visualize this information is to chart out a retention curve, showing the retention of these cohorts over time. The chart makes incredibly easy to infer when users are leaving your product.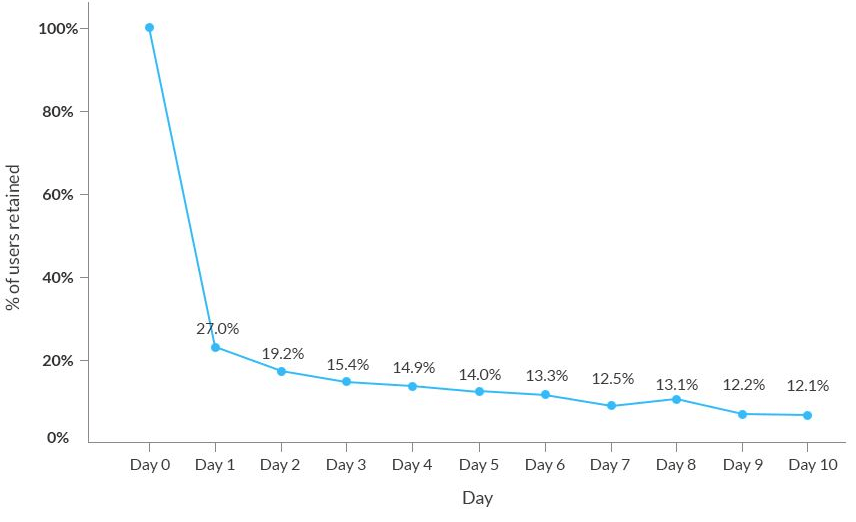 This retention curve immediately reflects an important insight – about 75% of the users stop using the app after the 1st day. After that initial large drop, a second brisk drop occurs after 5th day – to under 12%, before the curve starts to level off after 7th day, leaving about 11% of original users still active in the app at day 10.
The above retention curve indicates that users are not getting quickly to the core value of the app, resulting in drop-offs. Hence, it’s evident to improve the onboarding experience to get the user to the core value as quickly as possible, thereby boosting the retention.
Thus, acquisition cohorts are great for identifying trends and the point when people are churning, but it’s hard to make actionable insights like – to understand why they are leaving – which requires the use of another type of cohorts, behavioral cohorts
A simple example of behavioral cohort can be – all users who read reviews prior to purchasing a product. This can answer interesting questions, like,
An app user, after an app install and / or launch, makes hundreds of decisions and exhibit countless little behaviors that lead towards their decision to stay or go. These behaviors could be anything, like, using core feature Y but not using core feature Z, engaging only with notifications of type X, and so on.
Let’s test user’s behavior by comparing retention between below cohorts: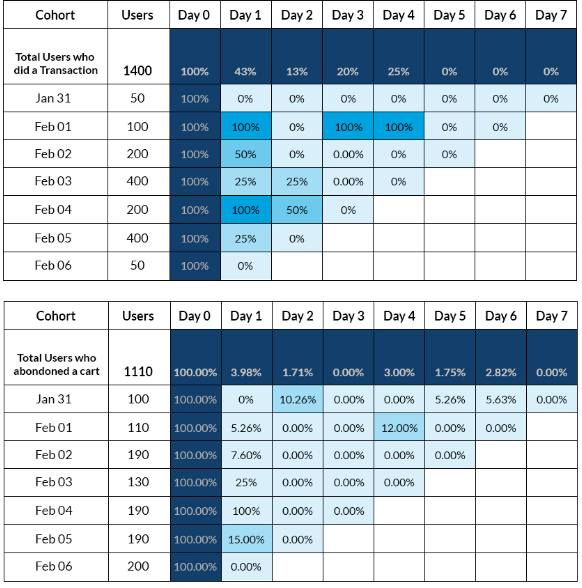
Both user segments had the intention to transact on your app. But one user segment chose to proceed with the checkout, the other choose to abandon your app. What you can do to reduce the shopping cart abandonment?
Cohort analysis can get answers to the questions like:
From the above retention tables, you can conclude that majority of the users who had abandoned the shopping cart did not engage with the app again, not even 1 day after the acquisition date. So, you have less than 24 hours to re-target them with the new offer and increase the chances of getting revenue.
From this data, you can develop a systematic, quantitative approach to know how users can fall in love with your app – and then make it happen again and again. Also, you can make strategies to increase your retention after ascertaining what works and what doesn’t.
The power of cohort analysis lies in the fact that, it enables not only to view which customers leave and when they leave, but also to understand why the customers leave your app – so that you can fix it. That’s how one can identify how well the users are being retained and also determine the primary factors driving the growth, engagement and revenue for the app.
Cohort Analysis: The Key to Improving Your App’s User Retention