Learn how you can Unlock Limitless Customer Lifetime Value with CleverTap’s All-in-One Customer Engagement Platform.
We are obsessed with collecting system and application metrics. This helps us make data driven, logical infrastructure decisions. When we started, we used collectd to collect metrics, a http proxy that reads incoming metric data emitted from collectd and writes to InfluxDB. With data in InfluxDB, Grafana visualised it for us.
Back then, Grafana had no support for reading time series data from Elasticsearch. InfluxDB and Graphite were the only options. Two years on, Grafana just got support for using Elasticsearch as a time series backend. This is very exciting for us since we already use Filebeat => Logstash => Elasticsearch <=> Kibana for central log storage, search and visualisation. This development presents an opportunity to remove the proxy we build and replace InfluxDB with Elasticsearch. I am going to talk about how we made the switch and things to look out for
Elastic search, Logstash and Kibana (ELK) is a popular stack for log storage and visualisation. No one appears to be talking about Elasticsearch, Logstash and Grafana. Understandingly, because support for Elasticsearch as a time series backed in Grafana is relatively recent. Like ELK, it appears to be a scalable, open source solution for storage and rich dynamic telemetry visualisation. I think this is going to be as popular as ELK.
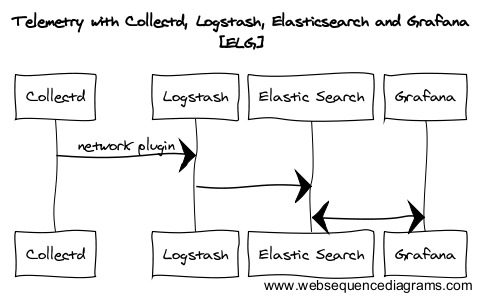
Collected metrics can be emitted to network using collectd’ network plugin. On the other end, Logstash’ UDP plugin provides a codec for collectd. Emitting data from collectd and consuming via logstash is well documented here Logstash to Elasticsearch is handled by elasticsearch output plugin.
Unlike InfluxDB, where Grafana supports autosuggest thanks to ‘list series’, when using Elasticsearch as a backend, it has no knowledge of how to map fields or where your values are. You have to use lucene queries to retrieve data points to graph.
Kibana to the rescue — no better way of querying and exploring your data. Even before you attempt to install Grafana, get this in place. Being able to see the document structure will save you hours. It also fits in perfectly when testing queries.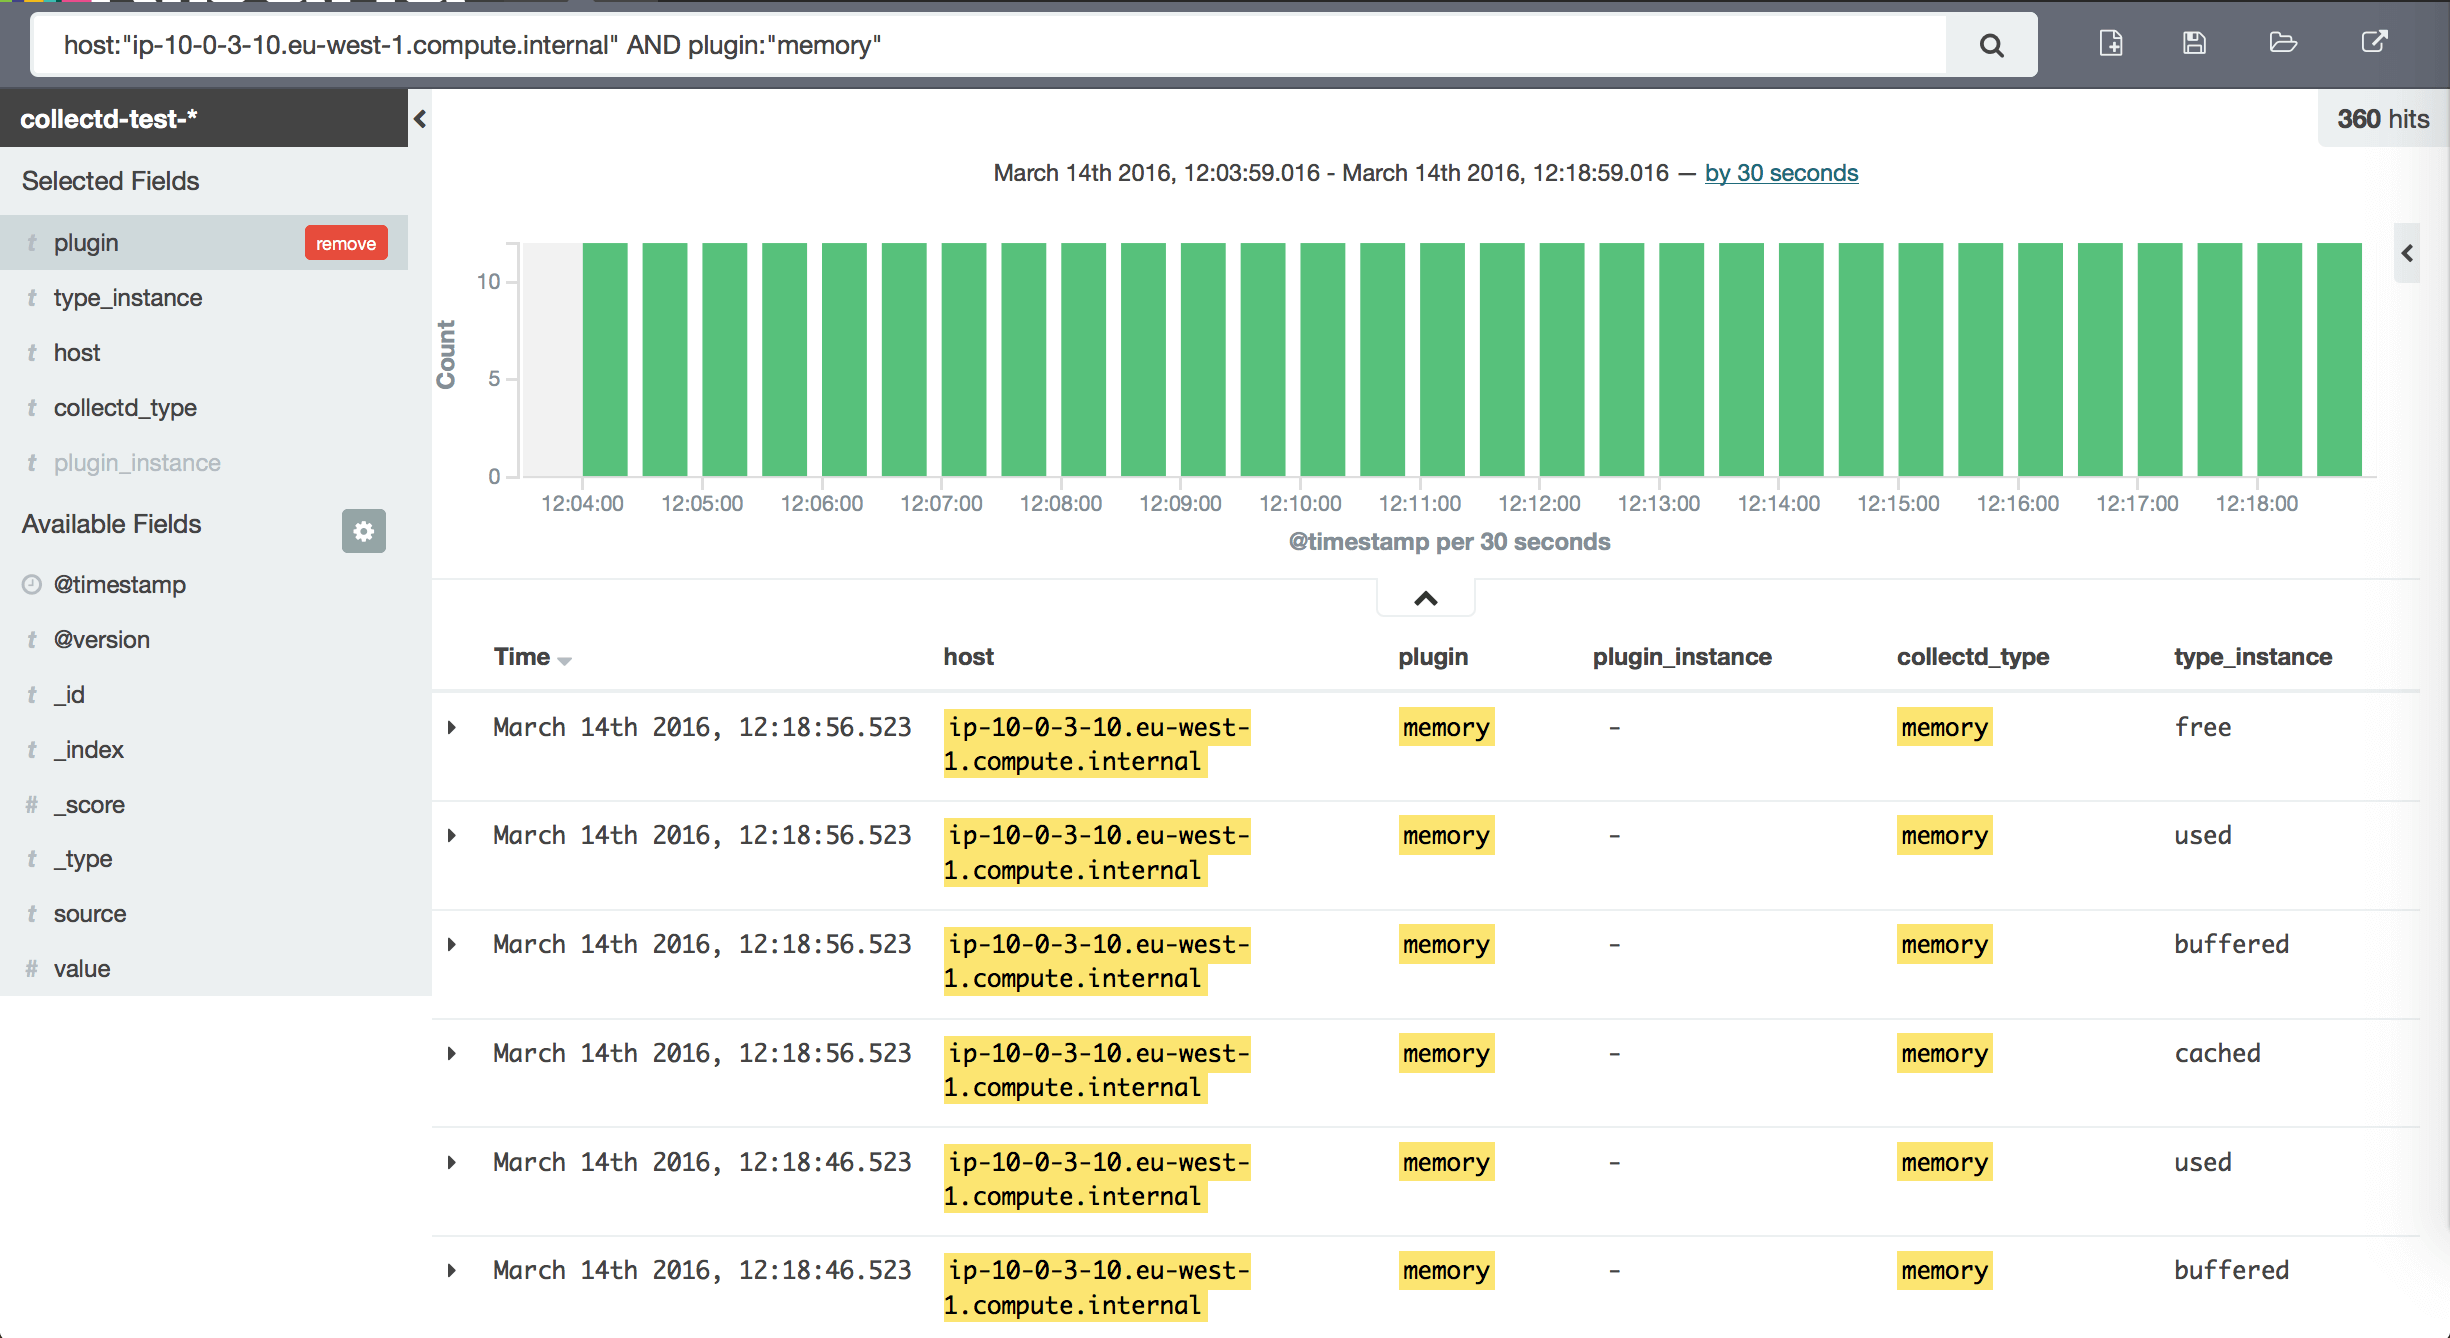
Metrics such as network (rx,tx) and CPU utilisation (in jiffies) are expressed as counter i.e the change in value is interesting.
Example: Collectd or any metric collection system will collect network ‘rx’ or ‘tx’ as an incremental number. Current point in time snapshot is useless. What you want to know is how much traffic have been received/sent since the last collected data point to work out traffic in that timeframe.
Elasticsearch supports derivative aggregation from version 2.0. Based on our experience, unlike InfluxDB’s derivative function which is aware of time units, Elasticsearch’ derivative does not take into account the timeframe. It works more like a difference between two values rather than derivative. You have to manually work out per second values based on how frequently your data is collected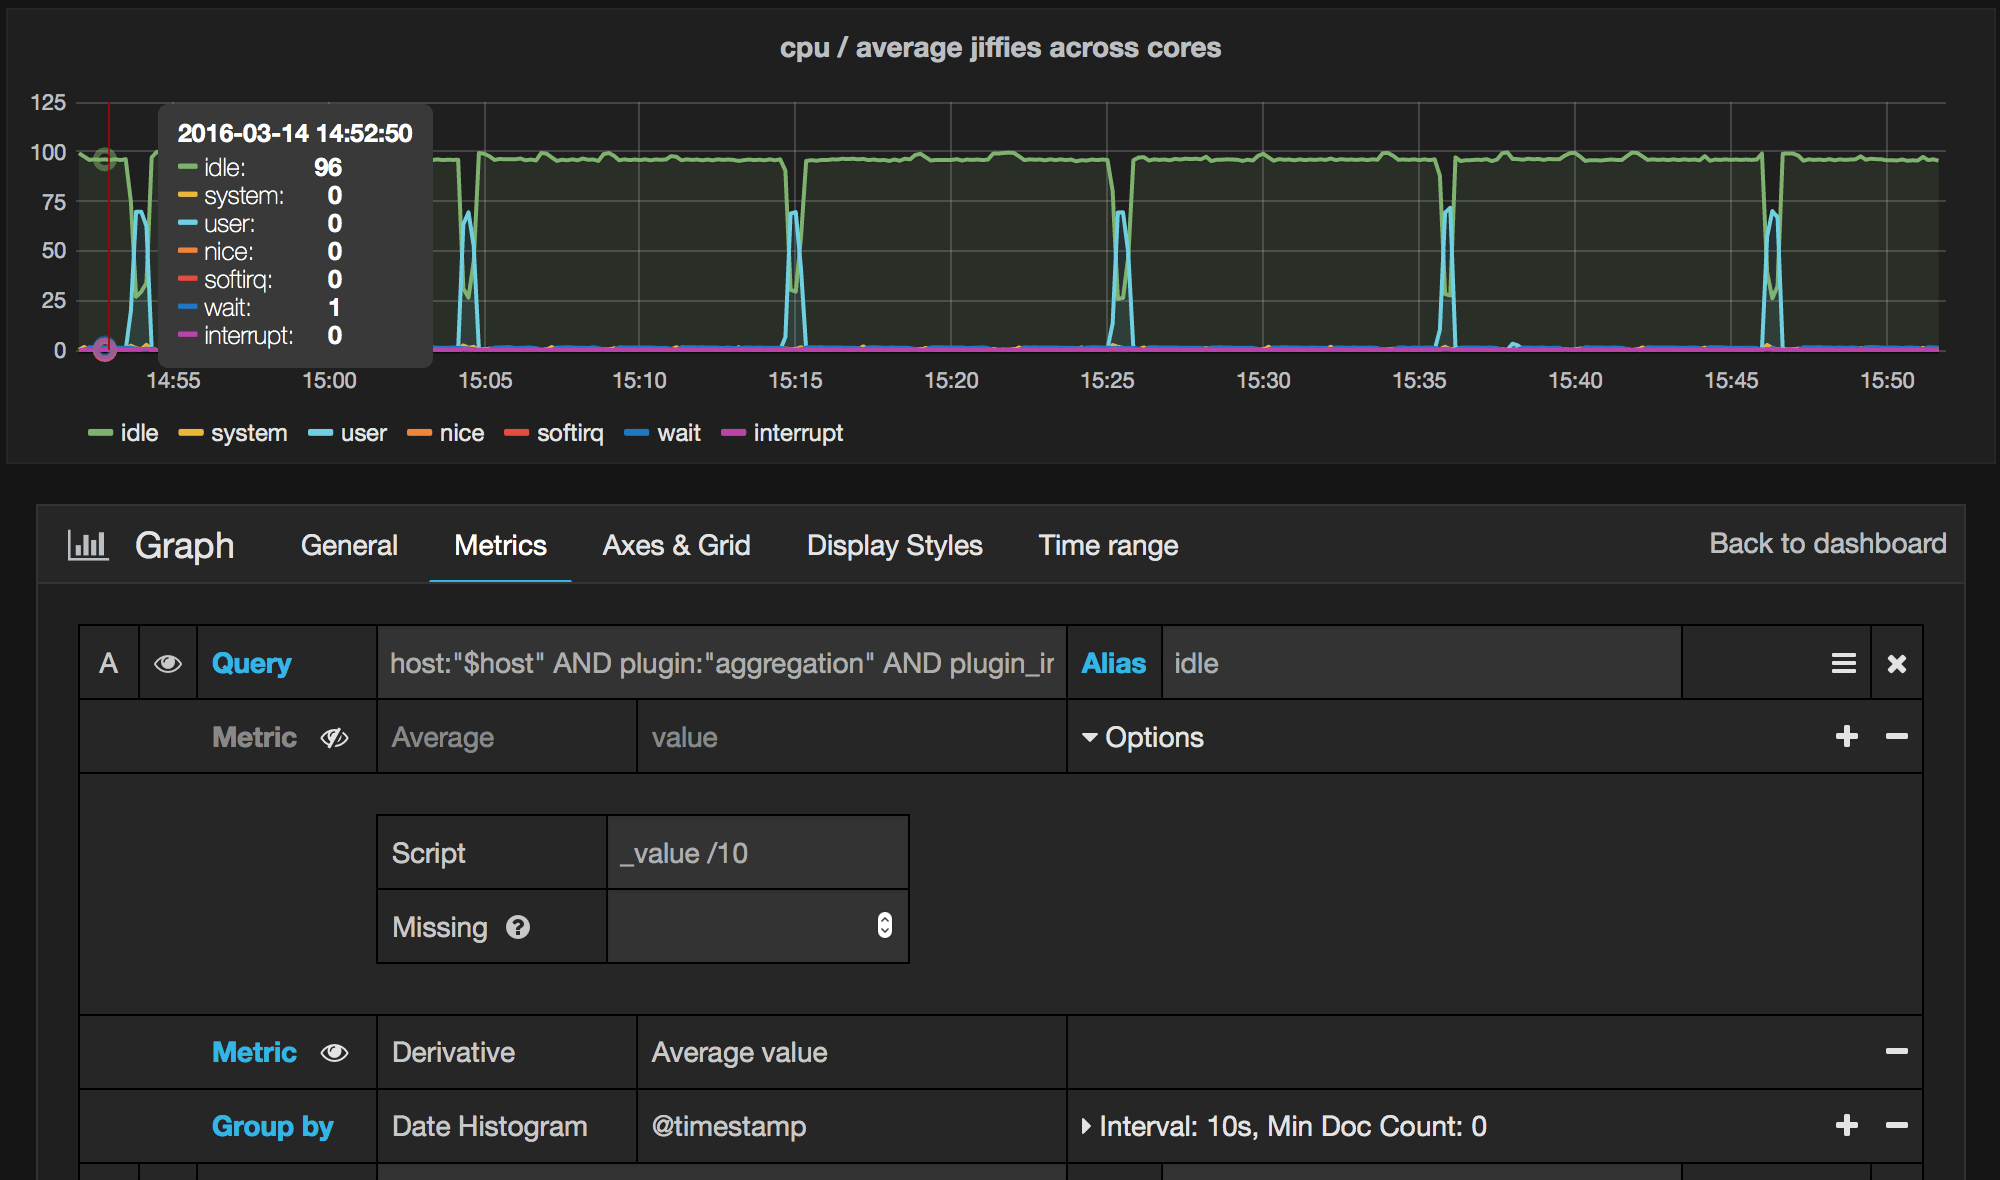
It’s tempting to spin up a AWS hosted Elasticsearch cluster to do a quick proof of concept. We did too, only to learn that AWS provides Elasticsearch version 1.5 which does not support derivative aggregation. Based on our conversation with AWS support, version 2.0 is in the roadmap but is not a priority for now. They recommend running ES on EC2 machines if you need version 2.0 and above.
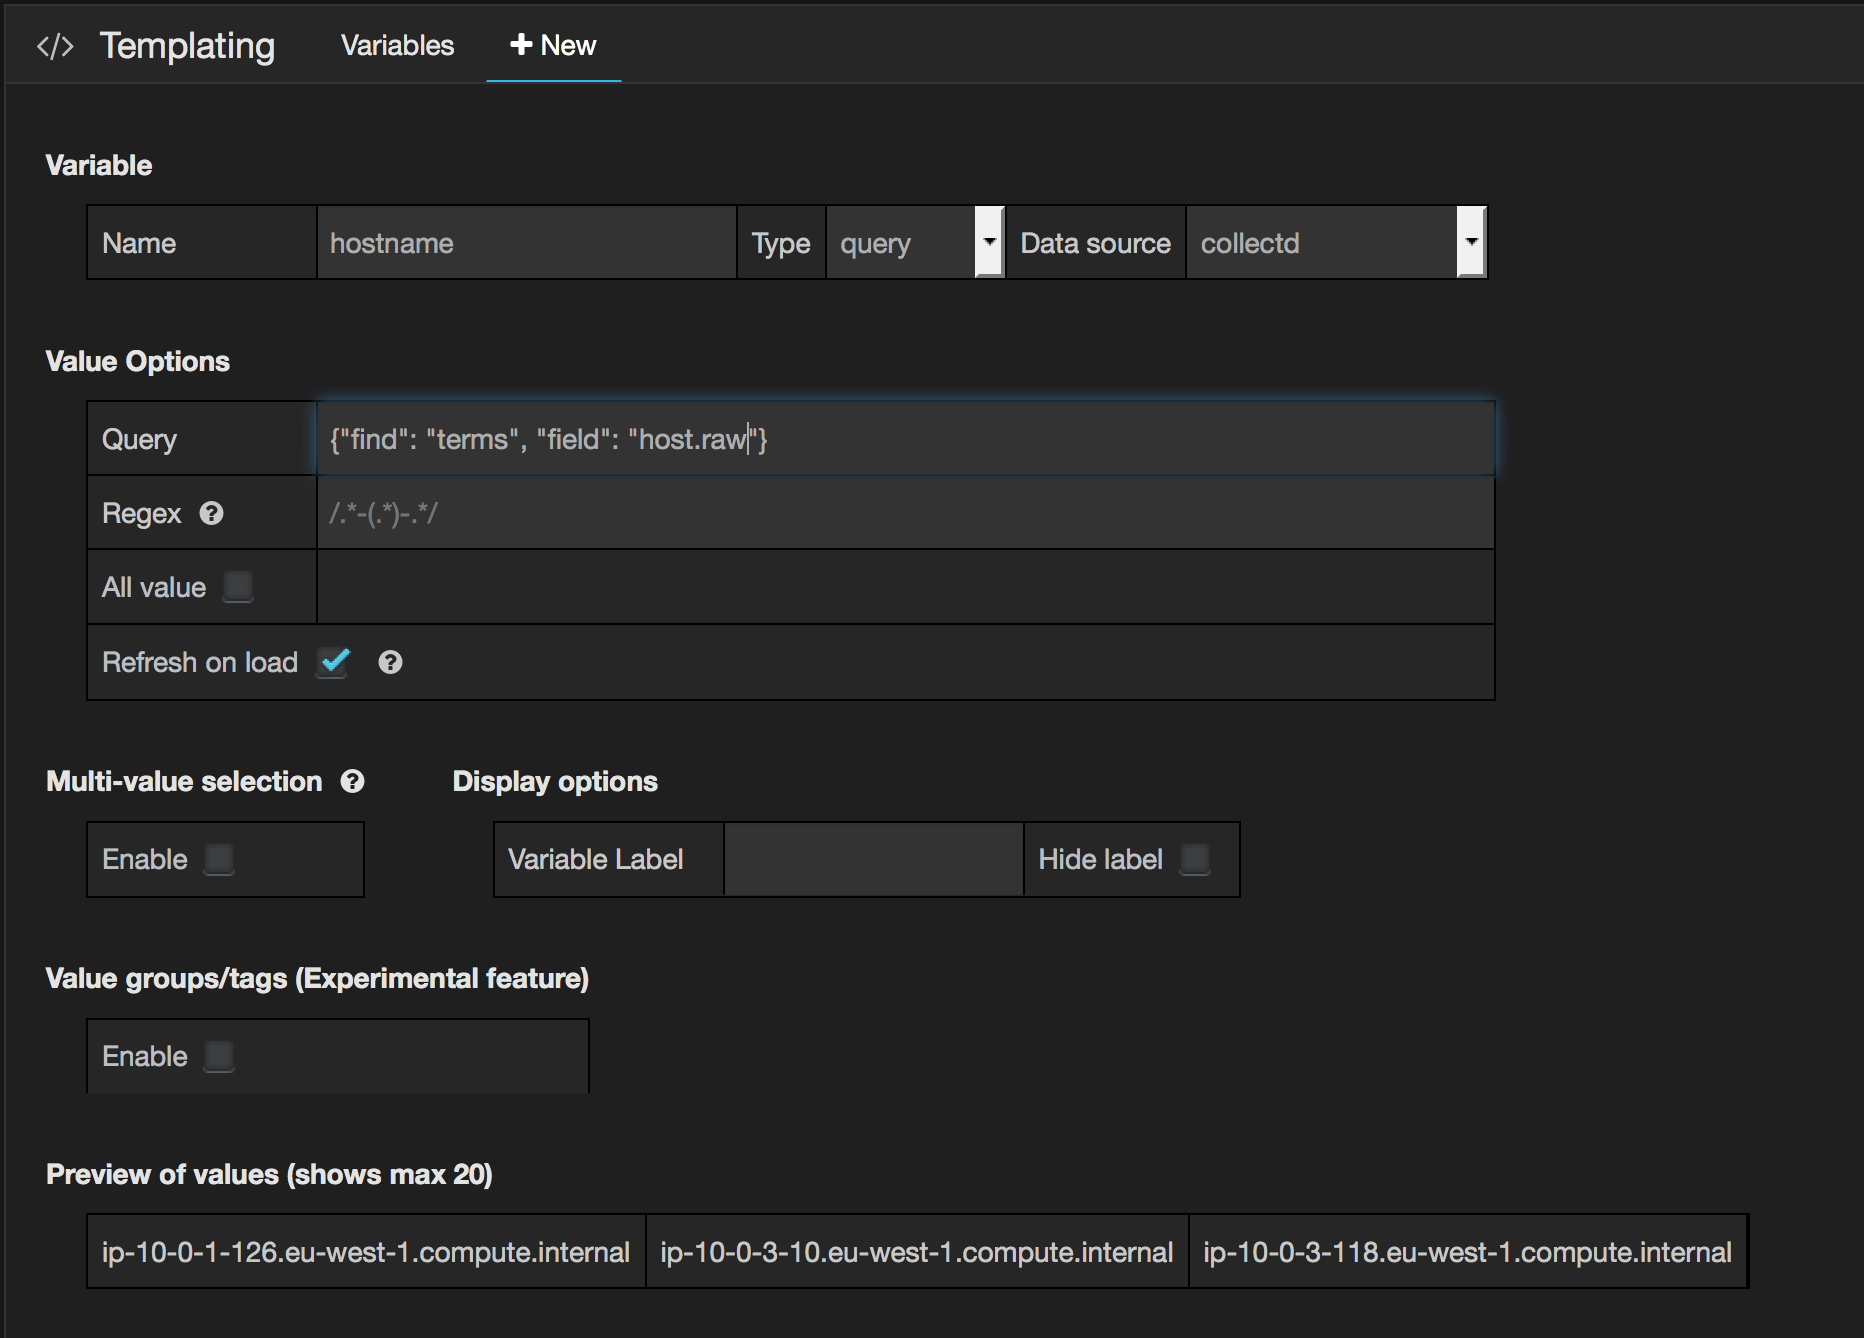
We changed the index name from logstash’s default (logstash-YYYY.MM.DD) to collectd-YYYY.MM.DD. When the index name is logstash-*, logstash applies sensible default index mapping on commonly know fields in elasticsearch before creating an index. Changing it meant the default index mapping template provided by logstash did not apply to our indexes. Our hostname field was indexed as ‘analyzed’. This cause it split on ‘-‘ and ‘.’ characters. If you are changing the index name, be sure to copy the default elasticsearch-template.json (find /opt/logstash/ -name elasticsearch-template.json), and edit the template name. You will also have to map it using ‘template’ and ‘template_name’ options for output plugin elasticsearch. Then use ‘{“find”: “terms”, “field”: “host.raw”}’ in your template variable query